Bitcoin (BTC) is closing Q1 2026 on a turbulent note, trading around $67,000 after a volatile month that saw prices swing between $65,000 and $75,000. With the Crypto Fear & Greed Index plunging to just 11 deep in “Extreme Fear” territory and BTC Dominance holding steady at ~58.2%, the market stands at a critical crossroads. Here’s what top analysts on X (formerly Twitter) are saying, and what on-chain data reveals about where Bitcoin could be headed next.

Bitcoin Price: A Month of Recovery and Retreat
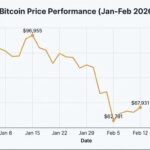
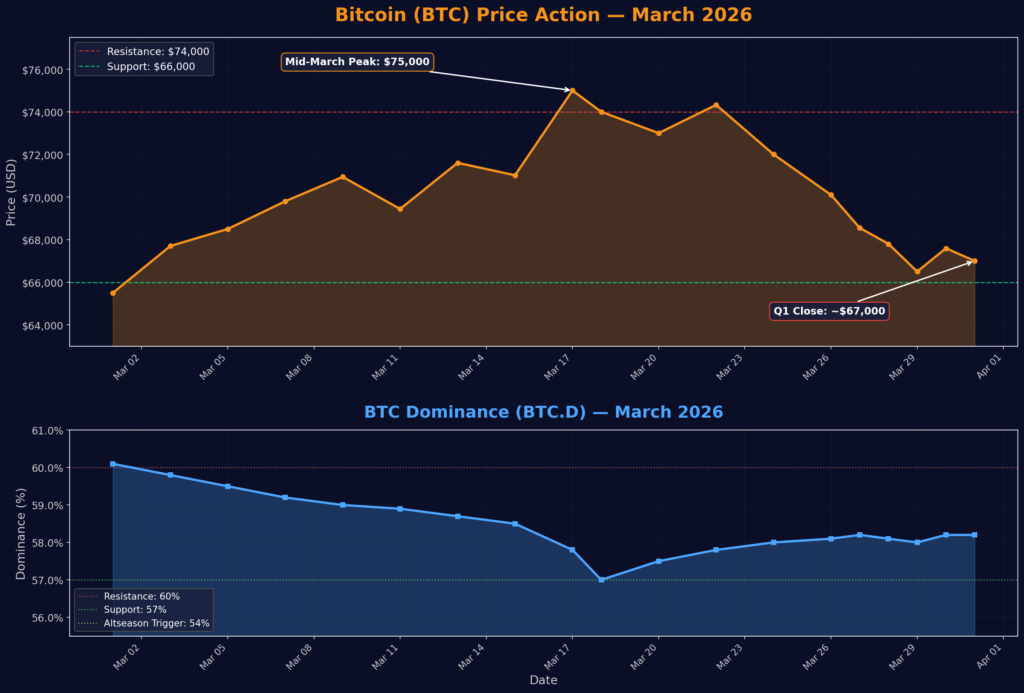
Bitcoin entered March 2026 trading in the $65,000 – $67,000 range, reflecting cautious sentiment after two consecutive months of declines in January and February. According to Cryptal’s analysis, the recovery phase began in the first two weeks as BTC climbed toward $71,000 – $73,000, signaling renewed buyer confidence.

By mid-March, Bitcoin reached its monthly peak near $74,000 – $75,000, buoyed by:
- Spot Bitcoin ETF inflows of $1.13 billion in March, breaking a four-month outflow streak (Rachael Lucas on X)
- Institutional buying, with Strategy (formerly MicroStrategy) acquiring over 22,000 BTC through March
- Short-term technical momentum pushing past key resistance levels
However, the March 18 FOMC meeting triggered a classic “sell-the-news” event, with BTC falling from a pre-FOMC high of $74,000 to $70,500, according to Intellectia.ai’s analysis. From there, the price entered a consolidation and pullback phase, ending the month around $67,000.
As of March 30, Yahoo Finance reported Bitcoin opened at $65,957 and recovered to $67,594 by morning, marking a -2.8% weekly decline and -20.1% year-over-year from when BTC traded near $88,745.


Key Price Levels to Watch
| Level | Price | Significance |
|---|---|---|
| Immediate Support | $65,000 – $66,000 | Psychological floor tested multiple times |
| Strong Support | $60,000 | Major buyer zone from February lows |
| Critical Floor (Willy Woo) | $46,000 – $54,000 | CVDD Bottom Model target |
| Immediate Resistance | $72,500 – $74,000 | Failed breakout zone |
| Major Resistance | $75,000 | EMA 26 resistance level |
| STH Price (Willy Woo) | $84,000 | Bull/bear market watershed |
BTC Dominance Analysis: Holding Above 58% – Altseason Delayed
Bitcoin Dominance (BTC.D) has remained a critical indicator throughout Q1 2026. According to BYDFi’s analysis, BTC.D has been hovering between 57% and 61.2%, maintaining a multi-year structural floor above 50% – the longest such stretch since 2017 – largely driven by massive institutional inflows from spot ETFs.
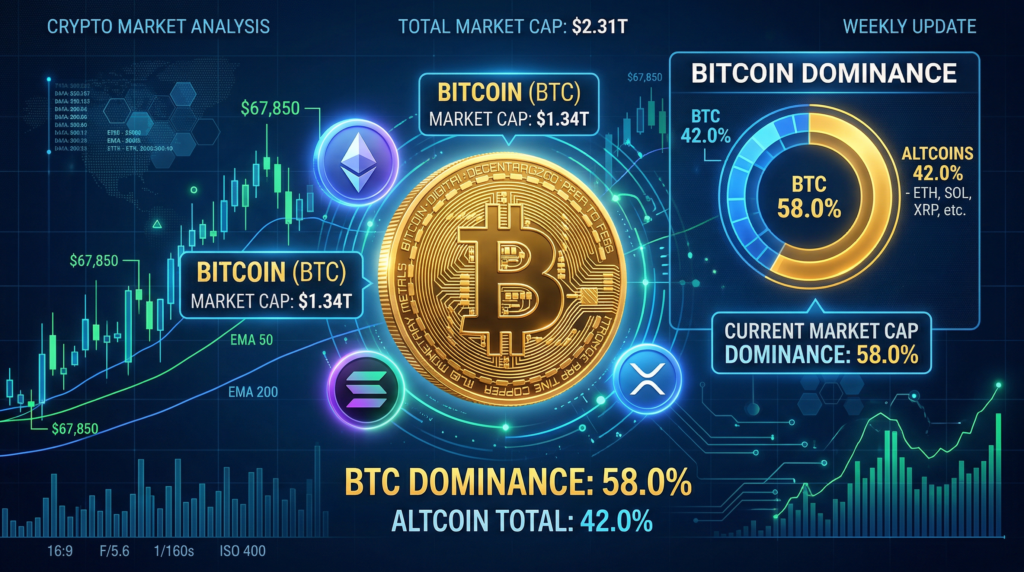
As of late March, CoinCodex data shows BTC Dominance at 58.22%, with Bitcoin’s market cap at $1.34 trillion against a total crypto market cap of $2.29 trillion.


What BTC Dominance Means for the Market
The current BTC.D levels tell a clear story:
- Above 60%: Bitcoin Season – BTC outperforms altcoins, “flight to safety” mode
- 57%–60% (Current Range): Transitional phase – capital cautious but not yet rotating to alts
- Below 54%: Altseason trigger – historically signals major altcoin outperformance
- Below 40%: Full altseason – last seen in 2021
According to crypto trader TATrader_Allan, as reported by MEXC, Bitcoin dominance has signaled a potential reversal after breaking down from a bearish pennant pattern on the weekly chart. He believes BTC.D has already formed a lower low, predicting fresh capitulation in the coming weeks.
Is the much-anticipated altseason 2026 on the horizon? A recent analysis of Bitcoin dominance might hold the answer.— Finbold (@finbold) March 10, 2026
Analyst Matthew Hyland argues that an incoming monthly death cross of Bitcoin dominance will trigger its next major crash below 40%, potentially mirroring 2021 performance. However, analyst CyrilXBT offers a contrarian view, noting on X: “Bitcoin dominance is printing a higher low, and money is rotating back into BTC, not alts.”
The Altcoin Season Index currently stands at 34 – 37/100 firmly in “Bitcoin Season” territory, far below the 75 threshold needed to confirm altseason.
What Top X (Twitter) Analysts Are Saying
Michael Saylor (@saylor) – The Perpetual Bull
Strategy’s Michael Saylor continues his relentless Bitcoin accumulation strategy, unfazed by the current downturn. In his latest disclosures on X:
Strategy has acquired 1,031 BTC for ~$76.6 million at ~$74,326 per bitcoin. As of 3/22/2026, we hodl 762,099 $BTC acquired for ~$57.69 billion at ~$75,694 per bitcoin. $MSTR $STRC— Michael Saylor (@saylor) March 23, 2026
Throughout March alone, Strategy executed multiple purchases:
- March 2: 3,015 BTC for $204.1 million at ~$67,700/BTC
- March 9: 17,994 BTC for $1.28 billion at ~$70,946/BTC (the 11th consecutive week of accumulation)
- March 23: 1,031 BTC for $76.6 million at ~$74,326/BTC
As reported by Yahoo Finance, Saylor posted a characteristic message reminding holders: “You know there’s a delay between the time we buy the Bitcoin and the time Bitcoin goes to the moon.” Strategy now holds 762,099 BTC – worth approximately $57.69 billion – despite sitting on unrealized losses of $3.35 billion.
There isn’t enough Bitcoin for everyone.— Michael Saylor (@saylor) March 2026
Willy Woo (@woonomic) – Cautiously Bearish for 2026
On-chain analyst Willy Woo has been one of the most data-driven voices on X this cycle, and his current outlook is decidedly cautious. In a January post that set the tone for Q1:
I’m bullish BTC late Jan through Feb but presently bearish for 2026. This is a data informed opinion which I hold lightly. Our internal models of investor flows put in a bottom on 24th December and has steadily strengthened. But I remain bearish 2026 because in the broader picture liquidity flows have been waning relative to price momentum since Jan 2025.— Willy Woo (@willywoo) January 11, 2026
His latest analysis, as reported by U.Today, highlights several critical points:
- Bitcoin has entered a deep consolidation phase that could last “several more weeks”
- The key barrier is the Short-Term Holder (STH) price at $84,000, which is declining daily
- Until BTC breaks $84,000, “expecting growth is pointless”
- Current market structure shows new money losing, treating rallies as exit opportunities rather than buying opportunities
More significantly, MEXC reported that Woo’s CVDD Floor Model suggests a potential Bitcoin bottom between $46,000 and $54,000, with the baseline value at approximately $45,500. According to ForkLog, Woo doubts a meaningful Bitcoin reversal before Q4 2026, with bullish momentum possibly returning only in early 2027.
PlanB (@100trillionUSD) – S2F Model Says $500K
The creator of the Stock-to-Flow model continues to maintain his ultra-bullish long-term thesis despite Bitcoin’s current 47% drawdown from its $126,000 all-time high.
Bitcoin at $67k… but S2F model screams $500k avg this cycle (2024-2028)! Is BTC massively undervalued & the ultimate buy opportunity? Or is S2F broken?— PlanB (@100trillionUSD) March 8, 2026
As reported by CryptoNews, PlanB’s analysis projects a range of $250,000 to $1 million for the 2024 – 2028 cycle, with $500,000 as the approximate midpoint. His earlier prediction, per KuCoin, dismisses the $126,000 October 2025 high as merely a local high, predicting Bitcoin’s true peak may occur between 2026 and 2028.
Rachael Lucas (@Rachael_M_Lucas) – Structural Picture Constructive
Crypto analyst Rachael Lucas provided a comprehensive Q1 closing summary:
30 March 2026 Daily crypto wrap: BTC holding US$66,600 to close Q1 after a volatile week. Hit US$72,000 on Wednesday on a geopolitical relief rally before pulling back. US spot Bitcoin ETF inflows for March hit US$1.13B, breaking a four-month outflow streak. Despite a 24% YTD decline, the structural picture remains constructive. Watch US$68,000 as the key BTC recovery level heading into April.— Rachael Lucas (@Rachael_M_Lucas) March 30, 2026
Key takeaways from her analysis:
- $68,000 is the key recovery level heading into April
- Despite a 24% YTD decline, the structural picture remains constructive
- Morgan Stanley’s MSBT launches in ~2 weeks with 16,000 advisors and $6 trillion in AUM — a major catalyst to watch
Market Sentiment: Extreme Fear Grips the Market
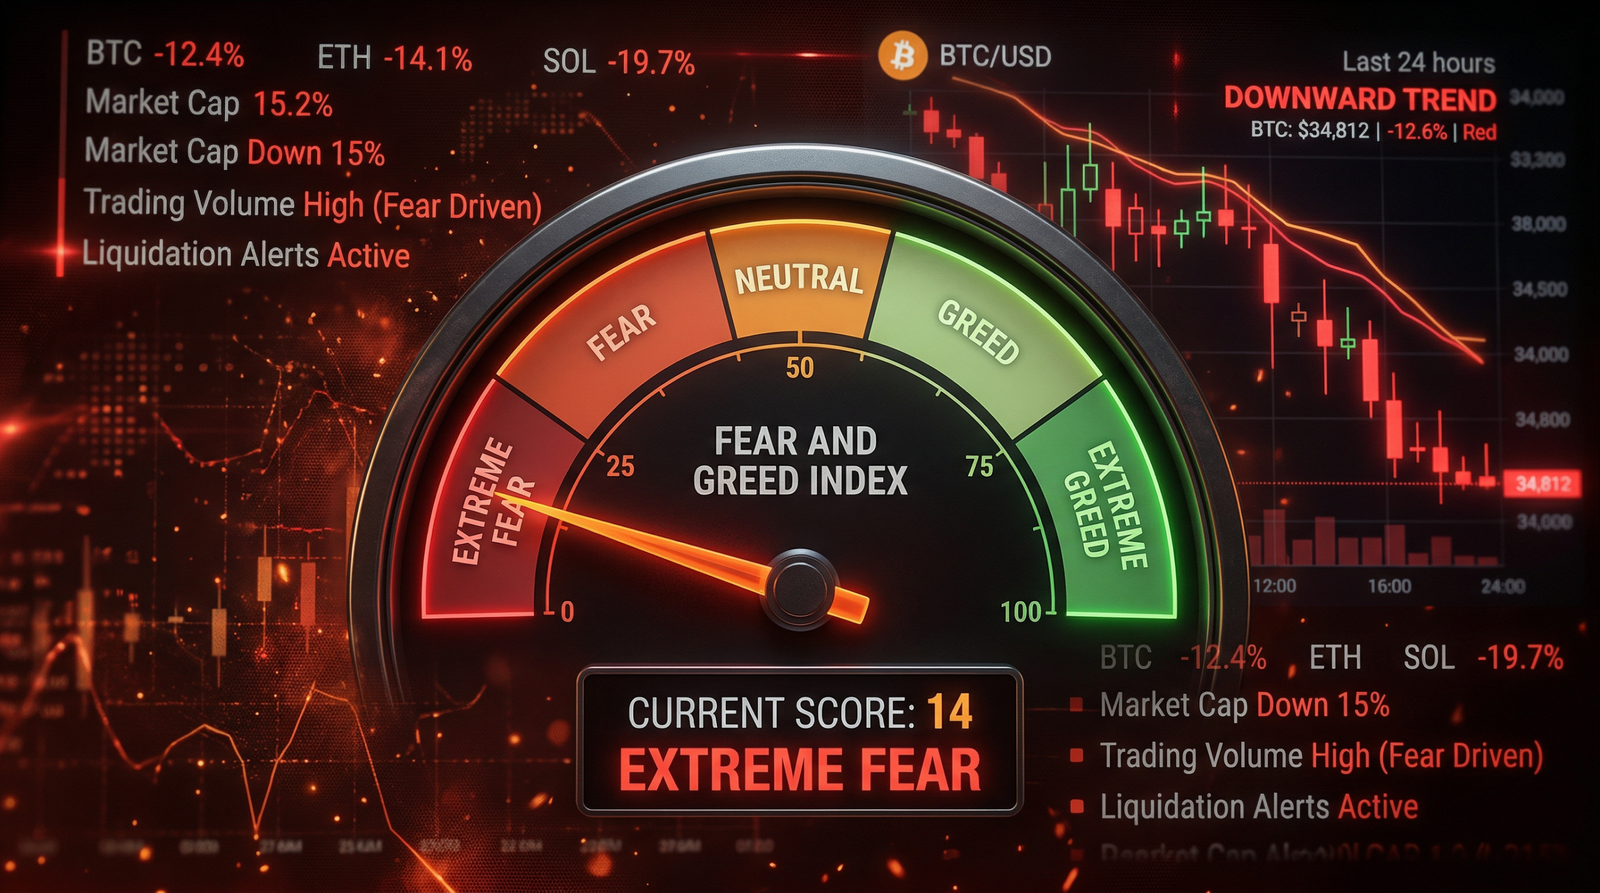
The Crypto Fear & Greed Index has plunged to 11 – deep in “Extreme Fear” territory according to Fear & Greed Meter. This is down from 8 just a day prior, with a 7-day average of 14 and a 30-day average of 28, as reported by RootData.
As CryptoRank noted, this three-point increase from the previous day “offers a fragile signal of stabilization, but analysts caution that it underscores the profound caution still dominating digital asset investment.”
What Extreme Fear Historically Means
According to the Milk Road Fear & Greed analysis, the crypto market has spent approximately 62% of its time in “Fear” or “Extreme Fear” since 2018. Historically, significant fear indicates turbulent markets but signals higher prices in the future, while significant greed signals coming price crashes. The current reading of 11 represents one of the most fearful periods in recent memory.
Bearish Technical Signals
CoinCodex’s technical analysis paints a concerning picture:
- 26 out of 31 indicators signal bearish, with only 5 bullish
- RSI at 38.81 – neutral but leaning oversold
- MACD histogram at 0.0000 – bearish momentum stalled
- Bitcoin trading at 0.37 on Bollinger Bands, closer to the lower band ($59,318) than the upper ($89,220)
Whale Accumulation: Smart Money Is Buying the Fear

Perhaps the most bullish signal amid the extreme fear comes from on-chain data showing massive whale accumulation. According to MEXC’s analysis of Santiment data:
- Whale and shark addresses (holding 10 – 10,000 BTC) accumulated 61,568 BTC (~$4.2 billion) in the past month
- Retail wallets added just 213 BTC in the same period a 291-to-1 divergence
- Bitcoin exchange outflows persisted throughout March, signaling cold storage transfers
Santiment stated: “The ranging pattern will break upwards when large wallets are accumulating, while retail is dumping – a very reliable pattern to signal the start of bull cycles.”
ETF Flows Reverse Course
The ETF picture has also improved significantly. MEXC reported that Bitcoin ETFs have recovered approximately 38,000 BTC (~$2.6 billion) over the past month, after a brutal February sell-off. Additionally, as noted by @satoxis on X, Spot Bitcoin ETFs recorded $2.5 billion in net inflows during March 2026 alone, with BlackRock’s IBIT attracting $160.8 million in a single session on March 23.
However, the cumulative 2026 ETF balance still sits at negative 4,000 BTC meaning the recovery has nearly erased the damage, but hasn’t fully reversed it yet.
Analyst Price Targets: Where Does Bitcoin Go From Here?
| Analyst / Firm | Short-Term Target | Long-Term Outlook | Key Thesis |
|---|---|---|---|
| Willy Woo | $46,000- $54,000 (bottom) | Bearish through spring; bullish momentum possibly Q4 2026 – Q1 2027 | CVDD model, declining STH price, waning liquidity flows |
| PlanB | – | $500,000 average (2024 – 2028 cycle) | Stock-to-Flow model, post-halving supply squeeze |
| Michael Saylor | – | Perpetual bull; “not enough Bitcoin for everyone” | Institutional adoption, scarcity thesis |
| Standard Chartered | – | $150,000 (2026) | ETF inflows, institutional demand |
| Galaxy Digital | – | $200,000 (Q4 2026) | ETF AUM >$250B, corporate treasury adoption |
| JP Morgan | – | $160,000 (end 2026) | Lightning Network scaling, rate cuts |
| Arthur Hayes | – | $750,000 – $1M (2026) | Limited supply, ETF adoption, geopolitics |
| Rachael Lucas | $68,000 key recovery level | Constructive despite 24% YTD decline | ETF inflows recovery, MSBT catalyst |
| Zondacrypto TA | $63,150 (extreme swing low) | Bearish pressure dominant | Technical support test, momentum below trend |
Sources: NAGA, MEXC, Intellectia.ai, Zondacrypto
What to Watch in April 2026
- $66,000 Support: As noted in the Zondacrypto technical analysis, if BTC breaks below $66,000, the next stop is the extreme swing low at $63,150.
- $68,000 Recovery Level: Rachael Lucas identifies this as the key level BTC needs to reclaim heading into April.
- Morgan Stanley’s MSBT Launch: With 16,000 advisors and $6 trillion in AUM, this could be a major catalyst for institutional inflows.
- April CPI Print: The next major macro trigger, according to MEXC’s market analysis.
- BTC Dominance Below 57%: A break below this level could accelerate altcoin rotation and potentially trigger the long-awaited altseason.
- Whale Accumulation Continuation: If the 291-to-1 whale-to-retail accumulation divergence persists, historical patterns suggest an eventual upward breakout.
Conclusion
Bitcoin closes Q1 2026 in a state of tension. The price action – declining from an all-time high of $126,000 in October 2025 to around $67,000 today – reflects a 24% year-to-date decline and a broader corrective phase that has tested investor resolve.
Yet beneath the surface of extreme fear (F&G Index at 11), the on-chain data tells a different story: whales are accumulating at a 291-to-1 ratio versus retail, ETF inflows have reversed with $2.5 billion entering in March alone, and Strategy’s Michael Saylor continues his relentless buying spree with over 762,000 BTC on the books.
The bearish case, led by Willy Woo’s data-driven analysis, warns of a potential bottom between $46,000 – $54,000 and months of “bear market pain” ahead. The bullish case, anchored by PlanB’s S2F model and institutional thesis supporters, sees the current prices as a generational buying opportunity within a cycle that could push BTC toward $200,000 – $500,000.
As always in crypto, the truth likely lies somewhere in between. The coming weeks heading into April will be decisive.
Disclaimer: This article is for informational purposes only and does not constitute financial advice. Cryptocurrency investments carry significant risk. Always conduct your own research (DYOR) before making any investment decisions.