
Bitcoin Tests $80K as BTC Dominance Holds Near 59%
Bitcoin is hovering near $80,400 after giving back its early-October gains. Neutral sentiment, uneven ETF flows and pressure across technology stocks have made $80,000 the key short-term support test.
Data note: price varies by exchange and timestamp; BTC dominance is the latest confirmed snapshot available from Bitbo Charts, updated October 24. The most recent confirmed Fear & Greed reading is October 25.
Also Read



Bitcoin Price: $80,000 Is the Immediate Line to Watch
Bitcoin began October near $84,900 in the historical series used here and recorded a daily high above $87,100 early in the month. By October 25, the daily close was near $80,534—roughly 5% below the start-of-month close and more than 7% below the early-month high. BTC briefly traded below $80,000 on October 24 before recovering toward that level.
Sources: Investing.com historical data · The Block market report

Chart: Investing.com daily closes for Oct 1–25 and a separately marked Oct 26 price snapshot from Goodreturns.
Also Read


The technical picture is conditional rather than outright bullish. Holding $80,000 could keep BTC inside its recent range. A recovery above $83,000 would help repair short-term momentum. A sustained break below $80,000 would put $77,000 in focus, with deeper support estimates around $76,700–$72,500.
What Analysts Are Saying on X
Ted Pillows: buyers need to defend $80K
Ted Pillows warned on October 24 that Bitcoin was approaching $80,000 and buyers needed to hold that level to avoid a worse breakdown.
Recent Posts



Michaël van de Poppe: a quick sweep could be absorbed, a deep break would not
Van de Poppe said he would prefer a sweep of the recent low followed by a quick recovery, while warning that a deeper correction below $77,000 would be more concerning.
Benjamin Cowen: reclaiming $83K would weaken the bearish scenario
Cowen outlined a downside scenario on October 24 that he said would be invalidated if Bitcoin recovered and held above $83,000.
The common theme is not a shared price target. It is the same map: $80,000 is the immediate support test, $83,000 is a recovery trigger, and $77,000 is a level analysts do not want to see lost decisively. X commentary reflects individual views, not a consensus forecast.
BTC Dominance Near 59% Keeps Altseason Claims in Check
Bitcoin dominance was reported near 59.03% in Bitbo Charts’ latest available snapshot, updated October 24. The provider showed an approximately 1.08 percentage-point rise over one month, indicating BTC has maintained or strengthened its share of the crypto market. Readings may differ across providers depending on market coverage and calculations.
Source: Bitbo Charts — BTC dominance
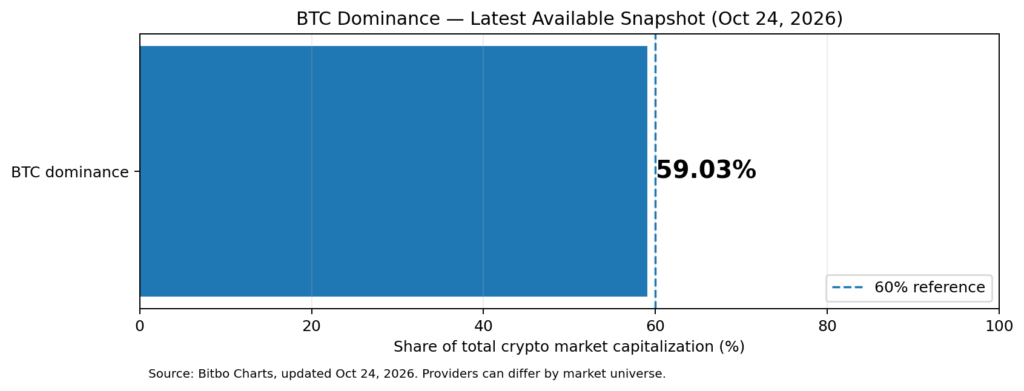
High or rising dominance during a BTC pullback generally suggests altcoins are not broadly outperforming Bitcoin. It does not prove BTC is attracting new capital: dominance can rise because altcoins fall faster. Current data do not support declaring a broad altcoin season.
ETF Flows: The Month Remains Uneven
U.S. spot Bitcoin ETF flows have been volatile. Through October 22, a Farside-linked tracker placed month-to-date net flows at −$175.6 million. The October 19–22 week was net positive by $439.1 million, but included a $635.6 million outflow on October 22. Secondary reporting put the October 23 outflow at about $137.9 million on a preliminary basis, implying about $301 million of net inflow over October 19–23 before final revisions.
Sources: BTC-Pulse ETF tracker · Daily ETF flow table
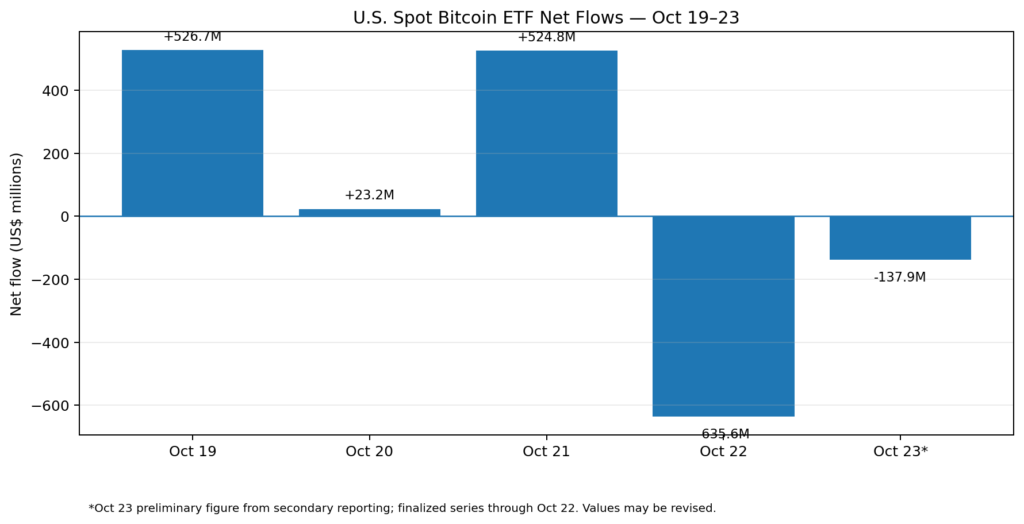
The takeaway is not that institutional demand has disappeared. Flows have become inconsistent: large positive sessions have been followed by large withdrawals. Until inflows become more persistent, ETF demand is a weaker bullish confirmation than during the late-September surge.
Sentiment Has Slipped From Greed to Neutral
The latest confirmed Crypto Fear & Greed Index reading was 54 (Neutral) on October 25, up from 51 on October 24 and 50 on October 23. At the start of October, the index stood at 74 (Greed). The shift suggests investors have become more cautious as BTC gave back its early-month gains.
Source: Altcoin Buzz, using Alternative.me data

Neutral sentiment can leave room for a recovery if support holds, but sentiment is not a standalone buy signal. Confirmation would need to come from price reclaiming resistance, healthier spot demand and more stable ETF flows.
Why Bitcoin Is Under Pressure: Tech Stocks, AI Spending and Geopolitics
The recent decline has tracked weakness in traditional risk assets. The Block reported that Bitcoin fell below $82,000 as a technology-stock sell-off spread to Asian markets. Concerns about AI spending and valuations, weaker earnings, U.S.–Iran tensions and rising oil prices contributed to a defensive backdrop. The Nasdaq Composite fell 2.6% in the cited session, while the S&P 500 lost 1.21%.
Read The Block’s October 22 report
Bitcoin has therefore traded more like a high-beta risk asset than a short-term safe haven. If equities stabilize and oil eases, BTC could recover; further risk-off selling could pressure $80,000 again. The market is also watching the Federal Reserve’s October 27–28 meeting and inflation data expected later in the week.
More on the upcoming macro catalysts — BeInCrypto
Bitcoin Price Scenarios for the Coming Days
| Scenario | Confirmation | Potential implication |
|---|---|---|
| Recovery | BTC reclaims and holds above $83K | Retest of $84K–$85K, then $86K–$87K supply area |
| Range-bound | BTC holds $80K but fails below $83K | Continued consolidation with weak follow-through |
| Bearish continuation | BTC loses $80K decisively and fails to reclaim it | $77K becomes the next downside test; deeper support estimates around $76.7K–$72.5K |
Market verdict: Bias is cautious to bearish in the short term while BTC trades below $83,000; $80,000 is the immediate line in the sand. The October pullback, neutral sentiment and inconsistent ETF flows argue against treating the earlier rally as a confirmed continuation.
For bulls, the first task is to defend $80,000 and reclaim $83,000. For bears, a sustained failure at $80,000 would strengthen the $77,000 downside scenario. Until one side wins that test, the most defensible reading is a volatile consolidation under macro pressure.
Disclaimer: This article is for information only, not financial or investment advice. Cryptocurrency prices are volatile; analyst opinions and technical levels are not guarantees.


 Join our Telegram Channel