
Executive Summary
Bitcoin currently trades at $87,355, down 0.59% from yesterday’s close, as the cryptocurrency battles within a critical range that could determine its year-end trajectory. With December marking a pivotal month for institutional adoption and regulatory developments, Bitcoin faces a complex technical landscape heading into 2026.
Current Market Data & Price Action

Key Metrics (December 29, 2025):


- Current Price: $87,355.77
- 24h Change: -0.59% (-$521.51)
- 24h Volume: $811.94M
- Market Cap: $1.73 trillion
- Bitcoin Dominance: 57.31%
December Price Performance
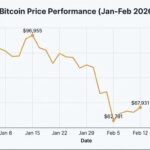
Bitcoin experienced significant volatility throughout December, with prices ranging from a low of $83,800 on December 1 to a peak of $94,640 on December 9. The cryptocurrency is currently trading approximately 3% below its yearly open of $93,400, marking a critical psychological level that analysts are closely monitoring.
Technical Analysis: Key Resistance and Support Levels

Critical Support and Resistance Zones
Immediate Resistance:
- $90,000 – Primary psychological barrier and recent consolidation ceiling
- $93,400 – Yearly open level, critical for maintaining bullish structure
- $95,000 – Previous month’s highs, key breakout target
Key Support Levels:


- $85,000 – Lower channel support with strong buying interest
- $80,000 – Major psychological support with thin historical activity
- $70,000-$80,000 – Critical zone with limited price consolidation historically
According to CoinDesk’s analysis, Bitcoin has spent only 28 trading days in the $70,000-$79,999 range over the past five years, highlighting potential vulnerability if prices decline to these levels.
Technical Indicators
RSI (Relative Strength Index): Bitcoin’s weekly RSI hit 33 in December 2025, marking its lowest level in nearly three years and signaling potential long-term buying opportunities for strategic investors AInvest.


MACD: Four-hour MACD shows signs of golden cross formation with RSI climbing to 55, indicating potential bullish momentum building Binance Analysis.
Market Sentiment & Fear/Greed Index

The Crypto Fear & Greed Index currently sits at 23 (Extreme Fear), reflecting widespread market pessimism. Historically, extreme fear readings have provided contrarian buying opportunities, with CoinDesk reporting that fear or extreme fear has accounted for more than 30% of readings over the past year.
Trading Volume Analysis

Trading volume patterns reveal significant volatility, with the highest volumes occurring during major price movements:
- December 16-20: $42.68B (major volatility period)
- December 11-15: $46.73B (peak selling activity)
- Current week: $23.75B (consolidation phase)
The volume decline suggests market participants are waiting for directional clarity, with many positions likely awaiting a catalyst to break the current range.
Institutional Adoption & ETF Flows
Bitcoin ETF Performance
Bitcoin ETFs experienced mixed flows in December, with recent analysis showing that despite “record outflows,” crypto ETP products absorbed $46.7 billion throughout 2025.
Key ETF Developments:
- Total ETF AUM: $103B by December 2025
- Institutional Holdings: 24.5% of Bitcoin ETF assets
- Projected 2026 Growth: Analysts expect $15B in additional ETF inflows Citigroup Analysis
Corporate Treasury Adoption
According to VanEck’s ChainCheck, Digital Asset Treasuries (DATs) added 42,000 BTC during the recent dip, representing their largest accumulation since July 2025.
Market Cap Trends

Bitcoin’s market capitalization has fluctuated between $1.71-$1.82 trillion throughout December, currently sitting at $1.73 trillion. For Bitcoin to reach analyst targets of $200,000, the market cap would need to approximately double to $4 trillion, requiring significant new capital inflows.
Holder Distribution & On-Chain Analysis

On-chain data reveals interesting behavioral patterns among Bitcoin holders:
Long-term vs. Medium-term Holders:
- Long-term holders (>5 years): Remain largely unmoved, showing diamond hands behavior
- Medium-term holders (1-5 years): Active selling, with significant reductions in 1-2yr (-900 bps), 2-3yr (-1250 bps), and 3-5yr (-550 bps) cohorts
- Institutional/ETF holders: Growing share of total supply at 57% dominance
This “diamond hands divergence” suggests that while newer investors take profits, veteran holders maintain conviction in Bitcoin’s long-term prospects.
Mining Network Health
Hash Rate Trends:
Bitcoin’s network hash rate dropped 4% over the past 30 days, marking the largest decline since April 2024. This reduction is attributed to:
- Chinese miners shutting down 1.3 GW of capacity in Xinjiang
- Reduced mining profitability with breakeven electricity costs falling to $0.077 (vs. $0.12 in December 2024)
- Approximately 400,000 mining machines taken offline
Contrarian Indicator: Historical analysis shows that when the 90-day hash rate growth is negative, 180-day forward BTC returns are positive 77% of the time, averaging +72% returns VanEck Research.
Regulatory Developments
Global Regulatory Landscape
2025 marked significant progress in crypto regulation globally:
United States:
- Passage of the GENIUS Act providing clearer regulatory framework
- Increased institutional access through approved ETF structures
- Growing discussion of Strategic Bitcoin Reserve proposals
Global Trends:
- Enhanced focus on stablecoin regulations across multiple jurisdictions
- Increased institutional adoption driven by regulatory clarity
- Tokenization of real-world assets (RWAs) emerged as significant structural development Proactive Investors
Analyst Sentiment & Price Targets
Prominent Analyst Views
PlanB (@100trillionUSD):
The creator of the Stock-to-Flow model noted Bitcoin’s drop below $100,000 in his December analysis, maintaining long-term bullish outlook while acknowledging near-term challenges.
Price Target Landscape:
Current analyst projections show significant disparity:
- JPMorgan: $170,000
- VanEck: $180,000
- Standard Chartered: $200,000
- Chamath Palihapitiya: $500,000
However, Investing.com’s analysis raises important questions about who will provide the buying pressure if consensus becomes too bullish.
Liquidation Risk Assessment
Current leverage positioning shows:
- $7.79 billion in short liquidations risk on 10% upside move
- $6 billion in long liquidations risk on 10% downside move
This two-sided exposure creates potential for sharp moves once Bitcoin breaks from its current consolidation range.
Year-End Outlook & 2026 Projections
Critical Factors for Year-End
- $93,400 Reclaim: Essential for maintaining post-halving bullish narrative
- $90,000 Defense: Key psychological support level
- Volume Confirmation: Need for increased participation to confirm directional moves
- Institutional Flows: Continued corporate and ETF adoption
2026 Catalysts
- Regulatory Clarity: Further regulatory developments in major jurisdictions
- Institutional Adoption: Potential $15B in additional ETF inflows
- Macroeconomic Environment: Federal Reserve policy and inflation trends
- Network Developments: Lightning Network scaling and Layer 2 adoption
Risk Assessment
Upside Risks:
- Sudden institutional adoption acceleration
- Positive regulatory developments
- Macroeconomic instability driving safe-haven demand
- Technical breakout above $93,400 triggering momentum buying
Downside Risks:
- Break below $85,000 support could target $70,000-$80,000 zone
- Continued ETF outflows and institutional selling pressure
- Regulatory setbacks or unfavorable policy changes
- Macroeconomic deterioration affecting risk assets
Conclusion
Bitcoin stands at a critical juncture as 2025 draws to a close. While the cryptocurrency faces near-term headwinds reflected in extreme fear sentiment and range-bound price action, underlying structural developments in institutional adoption, regulatory clarity, and network fundamentals remain supportive of longer-term bullish prospects.
The key battle for Bitcoin lies in reclaiming the $93,400 yearly open level and breaking above the persistent $90,000 resistance. Success in doing so could reignite upward momentum toward analyst targets, while failure may result in an extended consolidation period or test of deeper support levels.
Investors should monitor volume trends, institutional flow data, and key technical levels as Bitcoin navigates this pivotal period heading into 2026.
Disclaimer: This analysis is for informational purposes only and does not constitute financial advice. Cryptocurrency investments carry significant risk and past performance does not guarantee future results.