The bearish flip below $46k saw it retest prices last seen in early August

The crypto market is looking to recover from yet another downswing that saw the top coins drop to prices last seen in August.
Bitcoin price crashed to lows of $40,200 on Coinbase, with the broader market seeing similar losses. Ethereum slumped to lows of $2,837, while Cardano, XRP and Solana also experienced double-digit declines to break below key price levels.
According to on-chain data tracking site CryptoQuant, Bitcoin continues to see major accumulation in the $42,000 to $44,000 region as a decline in exchange reserves signals a long-term bullish outlook for BTC price.


At time of writing, Bitcoin has broken back above $43,000 as bulls seek a swift bounce towards $44,000 and possibly a daily close above $44,700.
Bitcoin price analysis
Bitcoin’s dip from highs of $48,380 on 19 September saw BTC/USD lose horizontal support around $44,721 on the daily chart.


The downward action resulted in a head and shoulders pattern, with the horizontal line acting as the pattern’s neckline as prices extended lower to retest the support of the 100 SMA and another horizontal anchor near $40,870.
Bears managed to prick the demand wall around this price as shown on the chart and tested the $40,200 low.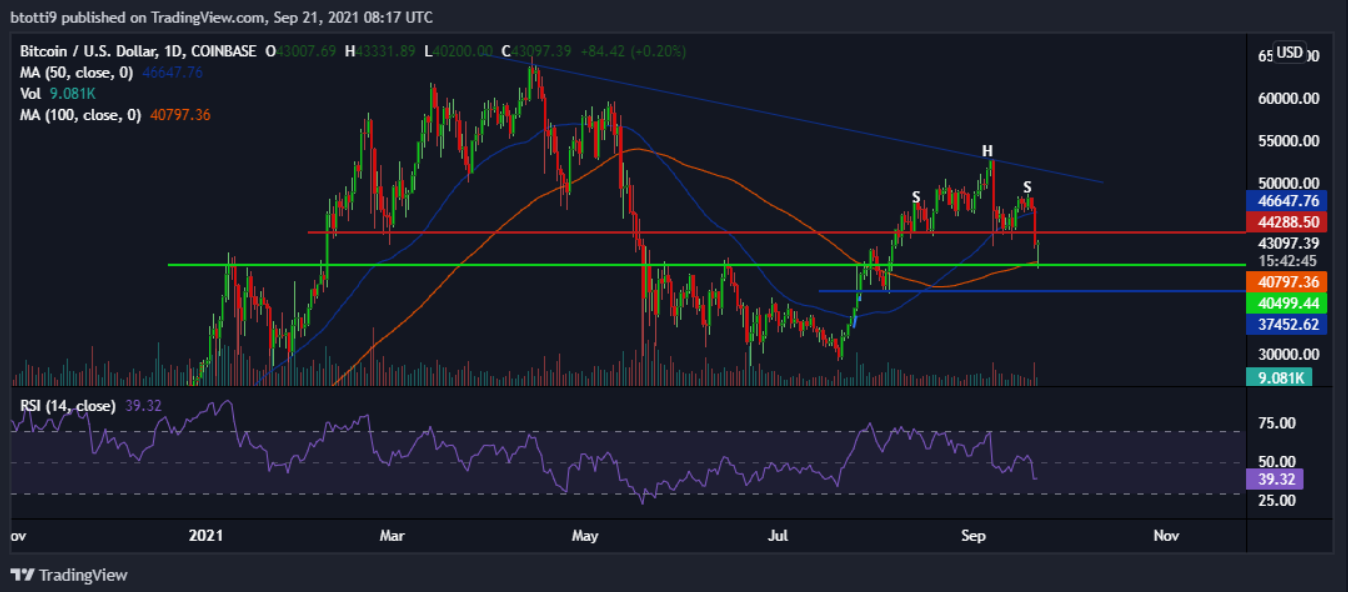
BTC/USD daily chart. Source: TradingView
The wick of the current candlestick suggests bulls are aggressively buying the dip; with an immediate target of $43,000, which is achievable if bulls maintain the bounceback momentum.
If buyers can target a daily close around $44,721, a move towards the 50 SMA ($46,648) could open up a path for a fresh push for $48,000 to $50,000 (where there’s likely to be a robust hurdle as suggested by the descending trendline).
On the downside, the RSI supports the bears and another dip could see Bitcoin price revisit support around $37,450 (blue horizontal trendline).
On the hourly chart, BTC price has broken above the 0.382 Fib level of the swing from $47,270 to $40,200 at $42,900. The bulls are likely to also breach the supply wall at the 0.5 Fib level ($43,735) to target the 0.618 Fib level ($44,569).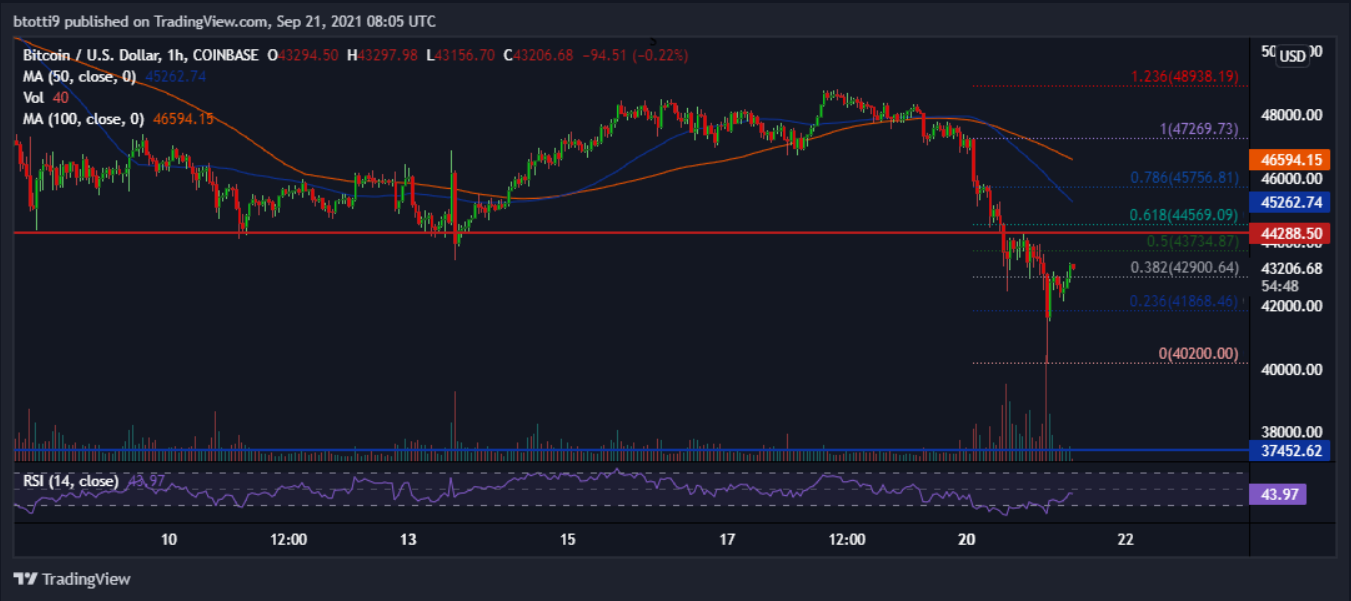
BTC/USD hourly chart. Source: TradingView
While the hourly RSI has moved from the oversold territory and is upsloping, the advantage remains with the bears. The downsloping curves of the 50 and 100 SMA also point to a struggle for bulls. BTC/USD might thus trade sideways below $45k before resuming the uptrend later in the year.
Check out our how to buy Bitcoin page here
The post Bitcoin price outlook: BTC seeks fresh upside after brutal retest of $40k appeared first on Coin Journal.
from CoinJournal: Home