
Bitcoin is trading around $72,483 on March 18, 2026, down 1.8% in the past 24 hours as crypto markets pull back ahead of the Federal Reserve’s interest rate decision. BTC dominance remains locked in a tight 58–60% range that has persisted for six months, and prominent analysts on X (formerly Twitter) are divided between those calling for a relief rally toward $85K–$90K and those warning the bear market is far from over.
Key Takeaways
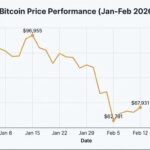
- Bitcoin trades at $72,483 with a market cap of ~$1.51 trillion, down ~42% from its October 2025 all-time high of $126,198
- BTC dominance consolidated at ~56.7%–57%, stuck between 58% and 60% for six months — a breakout in either direction will determine altcoin fate
- Willy Woo warns current rally is a “bull trap” driven by futures speculation, with the bear market only 1/3 complete
- Rekt Capital declares 2026 the year of the Bitcoin bear market, with $69K and $71.3K acting as overhead resistance
- Strategy (formerly MicroStrategy) purchased 22,337 BTC ($1.57B) last week, now targeting 1 million BTC by year-end
- Federal Reserve decision today expected to hold rates at 3.5%–3.75%; Powell’s forward guidance is the key catalyst
Bitcoin (BTC) $72,483 ▼ -1.8% (24h)

Market Cap $1.51T ▼ -1.7%
BTC Dominance 56.73% ▲ +0.40%
Fear & Greed Index 26 Fear


Data sourced from Yahoo Finance, YCharts, CryptoRank, and AInvest as of March 18, 2026.
Bitcoin Price Action: Testing Critical Resistance at $74,450
Bitcoin slipped back below a critical resistance threshold on Monday after failing to sustain gains above $74,450 — the April 2025 low that has since transitioned from support to resistance. According to Fortune, BTC opened at $72,483.20 on March 18, roughly $10,200 higher than the same time last year but approximately $1,234 lower than the previous day.


The retreat has renewed bearish sentiment across trading communities, though Coinpedia reports that the pullback of approximately 3.5% from recent highs is consistent with the choppy, overlapping structure characteristic of counter-trend advances rather than a confirmed trending move.
The crypto market pulled back alongside equities repositioning ahead of macro catalysts. According to TheStreet, Ether (ETH) fell over 3% to near $2,257, XRP declined 1.64% to $1.49, and Solana (SOL) slid 2.31% to around $91 as traders brace for the Fed’s decision.
Bitcoin holds above $65K in March 2026 as analysts predict a breakout rally toward $75K-$80K, supported by institutional ETF inflows and tightening supply.— Blockchain Reporter (@blockchainrptr) March 3, 2026
Key Support and Resistance Levels
| Level Type | Price Zone | Significance |
|---|---|---|
| Resistance 3 | $80,000–$85,000 | Measured move target on breakout |
| Resistance 2 | $74,000–$74,450 | April 2025 low / Key breakout level |
| Resistance 1 | $71,000–$71,300 | 2024 All-Time High / Immediate ceiling |
| Current Price | ~$72,483 | Trading within resistance zone |
| Support 1 | $69,378–$71,840 | Immediate support / Must hold for uptrend |
| Support 2 | $65,000 | Psychological + 50-day MA confluence |
| Support 3 | $61,530–$64,560 | Deep structural floor |
| Bear Target | $50,000–$53,000 | KillaXBT capitulation model / Filbfilb target |
Support and resistance levels compiled from analysis by Coinpedia, Intellectia AI, and E8 Markets.
BTC Dominance Analysis: The 58–60% Range That Will Decide Everything

BTC dominance has been consolidating between 58% and 60% for six months, with a breakout in either direction set to determine altcoin fate.
Bitcoin dominance (BTC.D) currently stands at approximately 56.73%, according to CryptoRank, having gained 0.40 percentage points in the past 24 hours alone. The metric has been consolidating in a tight range between 58% and 60% since September 2025, creating one of the most consequential chart setups in the crypto market.
Prominent analyst Ash Crypto (@AshCrypto) issued a stark warning about what happens when this range breaks, as reported by CryptoPotato:
Ash Crypto’s BTC Dominance Scenarios
- Break above 60%: Dominance rises to 63–64%, institutions buy only BTC, altcoins bleed further, and ETH/BTC hits new lows
- Break below 58%: Capital flows to ETH and altcoins, confirms ETH/BTC breakout above 0.0320 level, triggers a genuine altcoin season
Supporting this analysis, Finbold reports that renowned crypto trader TATrader_Allan identified a bearish pennant breakdown on the BTC dominance weekly chart, suggesting dominance has already formed a lower low and predicting fresh capitulation in the coming weeks. Meanwhile, trader Matthew Hyland argued that an incoming monthly death cross of Bitcoin dominance could trigger its next major crash below 40%.
Is the much-anticipated altseason 2026 on the horizon? A recent analysis of Bitcoin dominance might hold the answer.— Finbold (@finaborsa) March 10, 2026
The Altcoin Season Index has risen to 37/100 from 22/100 at the beginning of February, according to CoinMarketCap data — still firmly in Bitcoin season territory, but showing early signs of rotation.
Sheldon the Sniper’s Exact Altseason Trigger
Sheldon Diedericks, known as “Sheldon the Sniper” on Crypto Banter, laid out his precise conditions for going all-in on altcoins in a live session on March 17:
“Let it stop, let it pull back, buy support. The exact trigger is Bitcoin pushing to $80,000–$90,000 while dominance drops into the late 50s. Until that setup confirms, build positions slowly rather than chasing.”— Sheldon the Sniper, Crypto Banter (March 17, 2026)
Sheldon pointed to two key indicators: USDT dominance, which has already topped and started falling (indicating capital moving out of stablecoins), and BTC dominance dropping during rallies. He noted over 50 tokens are currently breaking high time frame trend lines, naming SUI, NEAR, Chainlink, and Ethereum as still in the early breakout window.
What Top Analysts on X Are Saying About Bitcoin

The battle between bulls and bears intensifies as Bitcoin trades at a critical juncture between key support and resistance zones.
Willy Woo: “Beware — This Will Be a Bull Trap”
On-chain analyst Willy Woo (@woonomic) issued one of the most closely-watched warnings of the week, cautioning that Bitcoin’s recent recovery is a dangerous bull trap driven by futures speculation rather than organic long-term buying, as reported by BeInCrypto.
“Beware this will be a bull trap, the bottom structure has not formed yet. From the liquidity picture I’m looking at we are around 1/3 of the way through the bear market.”— Willy Woo, On-Chain Analyst
According to CryptoRank’s detailed analysis, Woo’s examination reveals concerning patterns: the recovery stems largely from short-term futures market activity rather than fundamental improvements, with high leverage ratios, low spot volumes, and a disconnect between price and on-chain fundamentals. Despite this, his data suggests potential for Bitcoin to reach the mid-$80,000 range — the average cost basis for short-term holders — before the trap springs.
Rekt Capital: “2026 Is the Year of the Bitcoin Bear Market”
Popular technical analyst Rekt Capital (@rektcapital) declared that 2026 is the year of the Bitcoin bear market, with 2027 serving as the bottoming year and 2028 the trend reversal year, based on Bitcoin’s four-year cycle pattern.
It’s 2026 Looks like it indeed is the year of the Bitcoin Bear Market 2027 will be the Bottoming Out year for #BTC And 2028 will be the Trend Reversal year where $93500 would be finally broken $BTC #Crypto #Bitcoin— Rekt Capital (@rektcapital) February 5, 2026
In his March 9 newsletter, Rekt Capital noted that Bitcoin is interacting with two critical horizontal levels: the 2021 All-Time High at $69,000 and the 2024 All-Time High at $71,300, which together form an important overhead resistance region. He observed that BTC continues to produce upside wicks beyond these levels rather than decisive acceptance above them — a bearish signal suggesting that former all-time highs are turning into resistance.
PlanB: S2F Model “Screams $500K” — But Is It Broken?
PlanB (@100trillionUSD), creator of the Stock-to-Flow model, has been vocal about the disconnect between his model’s predictions and reality. Bitcoin closed 2025 at $87,496, down 6% from $93,381 at end of 2024, far below the model’s projections.
Happy 2026!! Bitcoin closed 2025 at $87496 Down -6% from $93381 end 2024.— PlanB (@100trillionUSD) January 1, 2026
In a more recent post, PlanB noted that his S2F model suggests $500K average for the 2024–2028 cycle, while Bitcoin languishes at $67K — raising the question of whether BTC is “massively undervalued and the ultimate buy opportunity” or whether the model is fundamentally broken. Meanwhile, a poll on his account showed 2 out of 3 respondents believe 2026 will be a bear market.
Austin Barack: “$90K Is Closer Than People Realize”
Offering a contrarian bullish view, Austin Barack (@AustinBarack) argued that Bitcoin outperformance versus tech equities is an underappreciated signal.
$90K Bitcoin is a lot closer than people realize. Every bear market has seen Bitcoin rally back to the 200 day moving average after the first major drop.— Austin Barack (@AustinBarack) March 17, 2026
KillaXBT: The Analyst Who Called the Top — Now Targeting $50K
One of the most discussed forecasts comes from KillaXBT, an analyst who accurately predicted Bitcoin’s peak above $100K and subsequent decline using “rotational market mathematics.” According to Yahoo Finance / 99Bitcoins, his revived chart now targets the $50,000 range as a capitulation event.
“Bitcoin is currently trapped within a ‘distribution band’ around the $70,000 range. Major market players are likely offloading their holdings during these minor price increases rather than making long-term purchases. The final phase of the model points towards a capitulation event aiming for the $50,000 range.”— KillaXBT’s analysis, via 99Bitcoins / Yahoo Finance
Filbfilb: $45K Joins Bearish Targets
Independent analyst Filbfilb has drawn attention to a historical pattern showing that every weekly close below a key trend line has resulted in a 40–50% correction since Bitcoin’s inception, as reported by Cointelegraph.
“In every instance since inception, a weekly close below the yellow band has resulted in a c. 40–50% correction. Levels c. $40–45K for the bands at the moment. A bounce off around $50K is not impossible, but ultimately, the price has met the lower band.”— Filbfilb, Independent Analyst, via X
Market Sentiment: Fear Dominates as Fed Decision Looms
The Cryptocurrency Fear & Greed Index sits at 26, deep in “Fear” territory, according to AInvest. Earlier in March, the index plunged to as low as 8 (Extreme Fear), per E8 Markets, while 86% of technical indicators were signaling bearish forecasts. The slight improvement to 26 represents cautious stabilization rather than genuine optimism.
Macro Catalysts to Watch
- Federal Reserve Decision (March 18): Markets widely expect rates to hold at 3.5%–3.75%. Focus is on Powell’s comments on inflation and forward guidance, especially with oil at $95/barrel due to geopolitical tensions (TheStreet)
- U.S.-Iran Geopolitical Tensions: Ongoing conflict has created significant headwinds; analysts say a confirmed ceasefire could trigger an 8–15% BTC rally within hours (E8 Markets)
- March 20 Options Expiry: Massive options expiry approaching, with the $75B options market now larger than futures for the first time in Bitcoin’s history
- Spot Bitcoin ETF Flows: Five consecutive days of inflows totaling ~$767M, with BlackRock’s IBIT purchasing $2.12B in the past three weeks (AInvest)
𝐁𝐓𝐂 𝐓𝐞𝐜𝐡𝐧𝐢𝐜𝐚𝐥 𝐑𝐞𝐩𝐨𝐫𝐭 | 𝟏𝟔𝐭𝐡 𝐌𝐚𝐫𝐜𝐡 𝟐𝟎𝟐𝟔 Bitcoin is showing gradual strength as it moves higher within its broader range, with price holding above key technical levels while market sentiment remains cautious. Overall, BTC continues to trade within a broader $65,000–$75,000 range, with $60,000–$65,000 as support and $75,000–$80,000 as resistance. #Bitcoin #TechnicalAnalysis— ZebPay (@zebpay) March 16, 2026
Institutional Activity: Strategy Buys $1.57B in Bitcoin
Despite the bearish sentiment, institutional accumulation continues at a staggering pace. Strategy (formerly MicroStrategy), the largest institutional Bitcoin holder, disclosed in an SEC filing on March 16 that it acquired 22,337 BTC between March 9 and March 15, 2026, spending approximately $1.57 billion.
The company now holds 761,068 BTC and has set an ambitious target of reaching 1 million BTC by the end of 2026. According to MEXC, this means Strategy needs to purchase approximately 261,269 more BTC at an average price of $85,000, requiring $22.2 billion in financing — averaging roughly 6,158 BTC per week for the remaining 42 weeks of the year.
Meanwhile, as Yahoo Finance reported, Willy Woo pushed back against expectations of a sudden institutional flood, noting: “You’re anticipating institutions to invest $3–4 trillion by 2026. That’s what your price suggests. In the past 17 years, only $1 trillion has been poured into BTC. As it becomes a multi-trillion-dollar asset, the pace slows down.”
U.S. spot Bitcoin ETF data from Alpha Node shows net inflows of approximately $643.38 million over seven trading days in early March, with total net assets near $90.89 billion by March 11.
On-Chain Data: Buyer Activity Returns, But Cautiously
CryptoQuant data shows volume delta turning positive on major exchanges after weeks of selling pressure. On February 16, Binance’s 30-day average volume delta sat at -$145 million, and Coinbase’s at -$88 million. Both have since flipped to approximately +$21 million and +$14 million, respectively.
“This represents an encouraging shift after a period dominated by selling pressure. That said, this trend still needs confirmation.”— Darkfrost, CryptoQuant Analyst
Bitcoin whales are also accumulating around $71K, according to Cointelegraph’s crypto recap, signaling a possible market bottom — though exchange balances continue to trend lower as long-term holders refrain from selling despite the uncertain price action.
Crypto Overnight Highlights | Mar 16, 2026 1️⃣ $BTC surged aggressively to $72K. $ETH posted modest gains, consolidating in the $2,100–$2,200 range. 2️⃣ Analysis: After the March 20 options expiry, momentum could shift.— followin (@followin_io) March 15, 2026
Wall Street’s 2026 Bitcoin Forecast: $150K Consensus Emerges
Despite the current drawdown, major financial institutions maintain bullish year-end targets. According to Finance Magnates:
Institutional Year-End 2026 Targets
- Standard Chartered: $150,000 (halved from prior $300K target); $500K pushed to 2030
- Bernstein: $150,000 for late 2026, approaching $200K by end of 2027
- CoinGecko compilation: Range of $60,000 (bearish) to $250,000 (bullish), with consensus clustering around $150K
- Robert Kiyosaki: Predicts Bitcoin will hit $750,000 “a year after the crash” (@theRealKiyosaki on X)
Fidelity’s 2026 Crypto Outlook notes that “we continue to see a shift to an entirely new cohort and class of investors,” with traditional money managers only scratching the surface of potential capital inflows. Coinbase’s institutional research argues crypto markets are “poised for transformative growth in 2026, as clearer regulation and accelerating institutional integration deepen crypto’s role in the core financial system.”
The Bottom Line: What Traders Should Watch Next
Bitcoin stands at a decisive crossroads in March 2026. The confluence of profit-taking pressures, geopolitical tensions, the Fed’s rate decision, and the battle between institutional accumulation and derivatives-driven speculation creates a market dynamic unlike any previous cycle.
Critical Signals to Monitor
- $74,450 breakout: A sustained hold above this level invalidates the lower-high thesis and could open the path to $80K+
- $65,000 support: A break below shifts the narrative dramatically bearish, with $60K and $50K as next targets
- BTC dominance range (58–60%): Direction of breakout determines altcoin fate for Q2 2026
- Fed forward guidance: Powell’s comments on inflation amid rising oil prices could set the tone for weeks
- ETF flow trends: Continuation of the five-day inflow streak would signal institutional conviction
- March 20 options expiry: $75B options market could trigger significant volatility
The bear case (Willy Woo, Rekt Capital, KillaXBT, Filbfilb) argues the current cycle follows historical patterns pointing to further downside toward $45K–$50K before a genuine bottom forms. The bull case (Strategy’s aggressive accumulation, institutional targets of $150K, positive ETF flows, Sheldon’s altseason signals) suggests the market is closer to a generational buying opportunity than a catastrophic decline.
As always in crypto, risk management remains paramount. Whether this proves to be a bear market rally or the early stages of a recovery will likely become clear when Bitcoin decisively resolves the $65K–$74.5K range it has been trapped in throughout March.
Disclaimer: This article is for informational purposes only and does not constitute financial, investment, or trading advice. Cryptocurrency investments carry significant risks, including the possibility of total loss of capital. Always conduct your own research (DYOR) and consult with a qualified financial advisor before making investment decisions. The views expressed by analysts quoted in this article are their own and do not represent the views of this publication.