NEW YORK — As the U.S. economy shows tentative signs of reaching a trough, a longstanding macroeconomic indicator — the copper-to-gold ratio — is drawing attention from cryptocurrency enthusiasts and investors who see it as a precursor to a major Bitcoin rally.
The ratio, which divides the price of copper by the price of gold, has historically signaled shifts in economic cycles and risk appetite. When copper, an industrial metal tied to manufacturing and growth, begins outperforming gold, a traditional safe-haven asset, it often indicates improving business conditions and a pivot toward riskier investments like cryptocurrencies.


Crypto analyst and X user MartyParty spotlighted this dynamic in a post Sunday, sharing a chart that overlays the ratio with Bitcoin‘s price history and the Institute for Supply Management’s manufacturing index. “Copper to Gold ratio is a known indicator to smart money that the business cycle (ISM) is bottoming,” he wrote. “When this happens its always before the trend to the parabolic crypto run.”
The accompanying chart highlights past instances where the ratio bottomed out — marked by green ovals — just before Bitcoin entered steep upward trajectories, depicted in orange lines. A purple line for the ISM index shows similar troughs, with an arrow suggesting a potential upturn ahead.


Recent data supports the notion of an economic nadir. The ISM manufacturing PMI dropped to 48 in July from 49 in June, marking five straight months of contraction but possibly nearing an inflection point, as readings below 50 denote shrinking activity. The overall economy, however, expanded for the 27th consecutive month, per ISM reports.
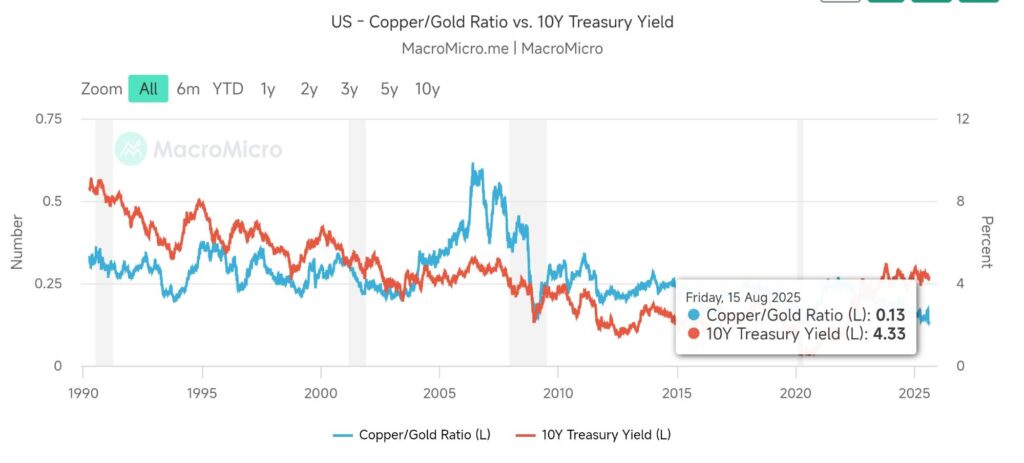
As of Aug. 15, the copper-to-gold ratio hovered at 0.13, a level that analysts say is close to historical lows and could signal an impending reversal if industrial demand rebounds. Copper prices, meanwhile, edged lower to $4.47 per pound on Aug. 15, reflecting ongoing concerns over global demand, including slowdowns in China.


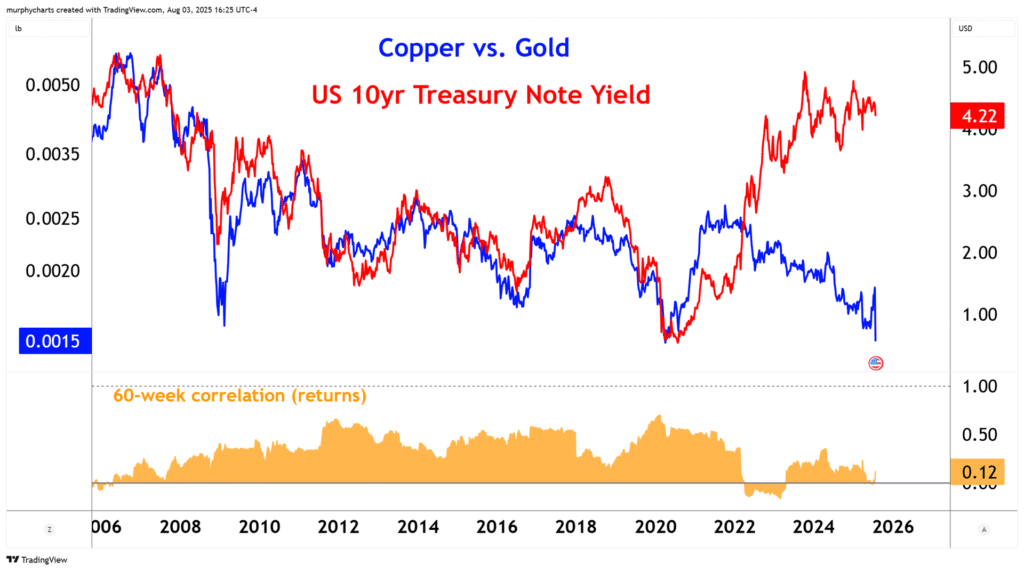
Market observers like Jeffrey Gundlach of DoubleLine Capital have long touted the ratio’s value in forecasting broader asset trends, noting its correlation with Treasury yields and equity performance. A recent analysis from the CMT Association described the ratio as “nearing an inflection point that could define the narrative into year-end.”
Yet, experts urge caution. While historical patterns from sources like SentimenTrader show strong links between rising ratios and market recoveries, external factors such as geopolitical tensions or supply chain disruptions can distort signals. A 2022 study in the Journal of Financial Economics highlighted that commodity ratios like this one may lag actual economic shifts and vary with international influences.
Responses to MartyParty’s post reflected a mix of optimism and curiosity. One user described the ratio as “pure risk-on vs risk-off,” suggesting copper’s outperformance heralds a shift to growth-oriented assets. Another inquired about complementary indicators, while a third noted learning about the correlation for the first time.
Bitcoin, trading volatilely amid broader market fluctuations, has seen similar patterns in past cycles, where economic recoveries amplified crypto gains. As of Sunday, the post had amassed over 1,000 likes and sparked dozens of replies, underscoring growing interest in macro signals for digital assets.
With the ratio at multiyear lows and PMI data hinting at stabilization, investors are watching closely for confirmation of a turnaround that could ignite the next “parabolic” phase in cryptocurrencies.