
Bitcoin continues its remarkable bull run in 2024, recently touching $80,073 and maintaining strong momentum above the $79,000 level. This comprehensive analysis examines the current market structure, technical indicators, and potential price targets for cryptocurrency traders and investors.
Current Market Overview
Bitcoin’s recent price action has been nothing short of extraordinary, with the leading cryptocurrency trading around $79,750 at the time of analysis. The digital asset has demonstrated impressive strength, posting a +4.34% gain in recent trading sessions. This movement comes amid substantial trading volume, with 24-hour turnover exceeding $15.94 billion, signaling robust market participation.
Key Price Levels
- Current Trading Range: $79,750 – $79,766
- 24-Hour High: $80,073
- 24-Hour Low: $75,688
- Critical Resistance: $80,000
- Immediate Support: $77,000
Technical Indicator Analysis
Moving Averages Paint a Bullish Picture
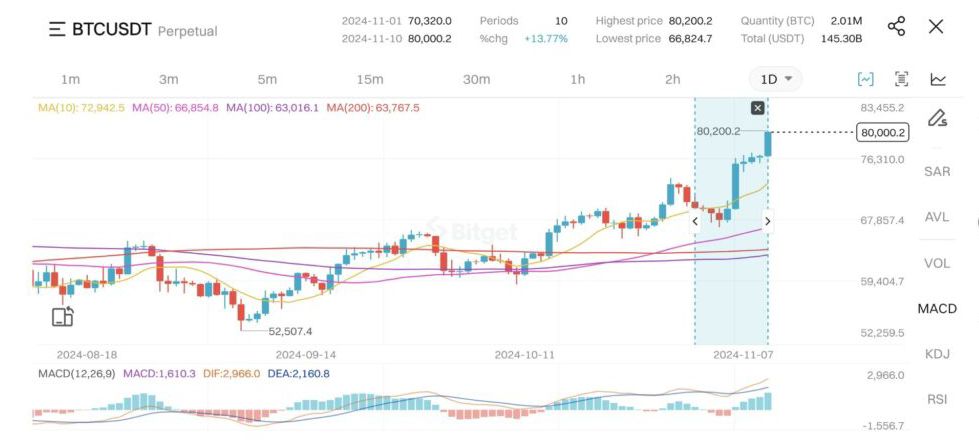
The current price structure shows Bitcoin trading well above all major moving averages, indicating strong bullish momentum across multiple timeframes:
- Short-term MA(10):
- 4-hour: 77,080
- Daily: 72,919
- Medium-term MA(50):
- 4-hour: 72,720
- Daily: 66,850
This ascending structure of moving averages creates a solid foundation for continued upward movement, with each MA potentially serving as dynamic support during pullbacks.
MACD Signals Strong Momentum
The Moving Average Convergence Divergence (MACD) indicator presents compelling evidence of sustained bullish momentum:
- 4-Hour Timeframe:
- MACD: 170.2
- DIF Line: 1,457.7
- DEA Line: 1,372.6
- Daily Timeframe:
- MACD: 1,580.5
- DIF: 2,947.3
- DEA: 2,157.1
The widening gap between DIF and DEA lines on both timeframes suggests accelerating bullish momentum, particularly on the daily chart where the separation is more pronounced.
Rate of Change (ROC) Confirms Trend Strength
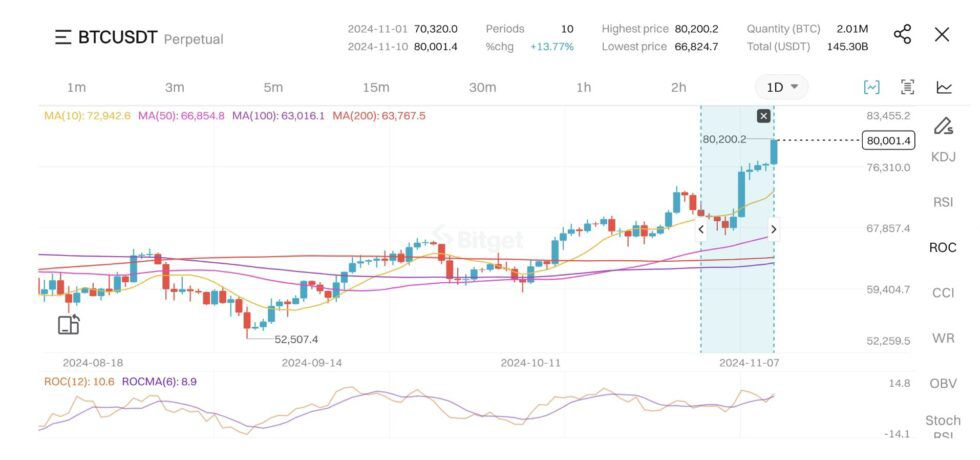
ROC readings across multiple timeframes validate the current uptrend:
- 4-Hour ROC(12): 4.4
- Daily ROC(12): 10.3
The significantly higher daily ROC reading compared to the 4-hour timeframe indicates stronger long-term bullish pressure and suggests potential for continued upward movement.
Volume Analysis and Market Dynamics
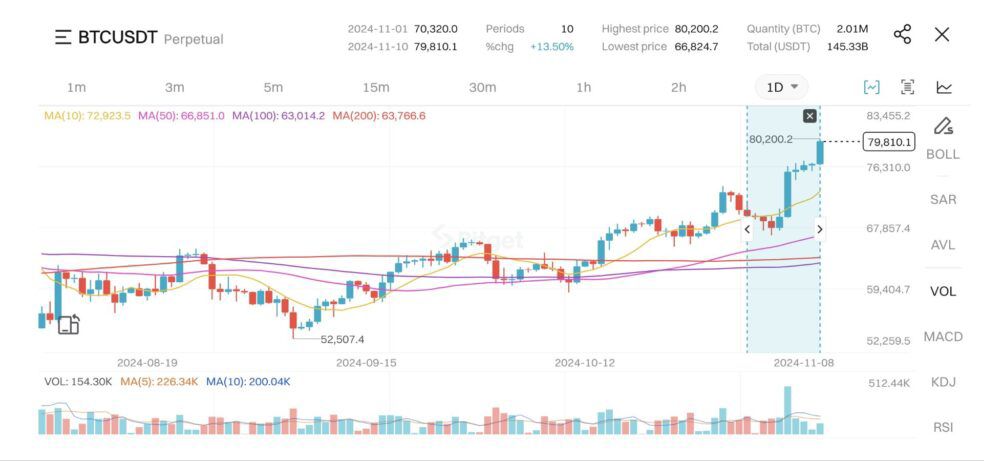
Recent trading sessions have witnessed notable volume spikes, particularly during upward price movements. This volume pattern typically indicates genuine buying interest rather than speculative activity, lending credibility to the current rally.
Support and Resistance Levels
Key Support Zones:
- Primary: $77,000 (MA10 4H)
- Secondary: $75,688 (Recent Low)
- Major: $71,074 (MA100 4H)
Resistance Levels:
- Immediate: $80,000 (Psychological)
- Secondary: $82,000
- Target: $85,000
Trading Strategies and Recommendations
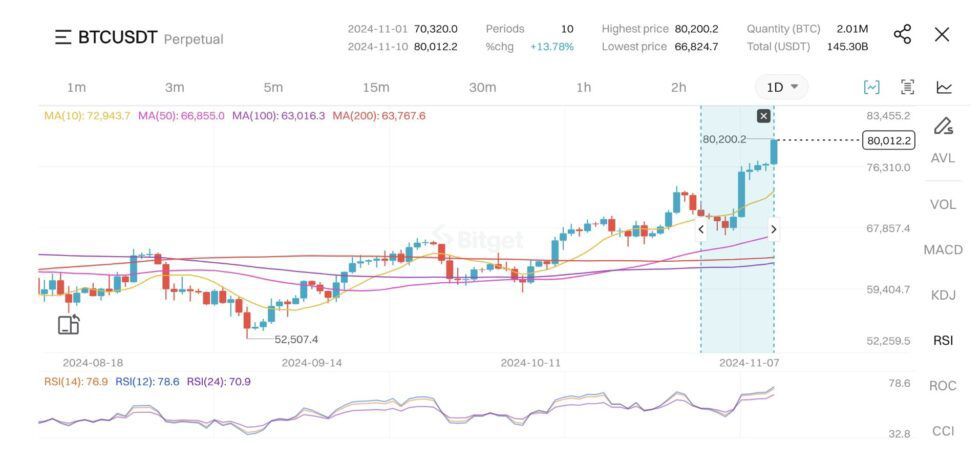
Short-Term Trading Approach
For traders focusing on shorter timeframes:
- Entry Points:
- Look for pullbacks to $77,000-$78,000 range
- Watch for volume confirmation at support levels
- Profit Targets:
- First target: $80,000
- Secondary target: $82,000
- Extended target: $85,000
- Risk Management:
- Stop Loss: Below $75,000
- Position Sizing: Maximum 2% risk per trade
- Scale out at resistance levels
Medium-Term Position Strategy
For swing traders and position holders:
- Accumulation Zones:
- Primary zone: $72,700-$71,000
- Secondary zone: Near MA(50) daily at $66,850
- Target Levels:
- Primary: $85,000
- Secondary: $90,000
- Ultimate: $100,000
- Risk Parameters:
- Stop Loss: Below $68,000
- Position Building: Gradual accumulation on dips
- Profit Taking: Scale out approach at major resistance levels
Market Sentiment and External Factors
The current market structure benefits from several positive factors:
- Institutional Interest: Continued adoption by major financial institutions
- Technical Structure: All major indicators aligned bullishly
- Volume Profile: Strong buying pressure with institutional participation
However, traders should remain vigilant of potential risks:
- Regulatory developments
- Macroeconomic shifts
- Technical exhaustion at psychological resistance levels
Conclusion
Bitcoin’s technical structure presents a compelling case for continued upward movement, with multiple indicators confirming the bullish trend. The alignment of moving averages, MACD momentum, and volume patterns suggests potential for further gains, particularly if Bitcoin can establish itself above the critical $80,000 level.
For traders and investors, the current market environment offers opportunities across different timeframes, though proper risk management remains crucial given Bitcoin’s historical volatility. The technical target of $85,000 appears achievable in the near term, with potential for extension toward $90,000 if current momentum persists.
Remember that while technical analysis provides valuable insights, it should be combined with fundamental analysis and proper risk management for optimal trading results. Always size positions appropriately and never risk more than you can afford to lose in this highly volatile market.
Disclaimer: The following analysis is meant for educational purposes only. Please note that cryptocurrency markets involve substantial risk. Always perform thorough independent research before making any financial decisions.







 Join our Telegram Channel